 Call Today
 Contact Us
Since I began teaching test prep in 2015, I have worked with hundreds of students, many of whom were top academic performers with impressive GPAs. In my early days in the classroom, I was surprised to find myself acting as not only an instructor but also a therapist for these students, fielding countless test prep woes when scores and expectations failed to align. For so many, a performance that would have been honor roll worthy in school just didn’t equate to a high score on a standardized test.
The reason? Although the SAT and ACT may be “standardized” tests, they are a far cry from typical exams administered in high schools across America. As I quickly emphasized to my discouraged students, however, they are both predictable and beatable.
HOW A GAME PLAN CAN IMPROVE YOUR SAT AND ACT SCORES
Looking back on my own high school standardized test experiences (for which I prepared independently and minimally), I realize that if I had been aware of just a few key strategies and features, I would have been able to boost my score and gain even more of a competitive edge on my college applications. I’m now on a mission to share as many of these “trade secrets” as I can in order to help all the perfectly capable students out there increase their scores by gaining deeper insight into these tests.
To begin, let’s consider the purpose of a test you’d take in school versus that of a collegiate standardized test:
Purpose of tests in school: to measure your knowledge of course content Purpose of the SAT/ACT: to demonstrate competitiveness for college admissions and capability to complete college-level coursework
In school, your tests measure your mastery of a given topic, and therefore your teachers are relatively unlikely to create misleading questions with less-than-straightforward answer choices to intentionally drag down your score (unless you have a particularly sadistic teacher). The SAT and ACT, however, are designed by well-paid data scientists who will use all the tricks up their sleeve to ensure a predictable distribution of results—even down to the percentage of students who will choose each of the four (or five) answer choices to a given question.
STANDARDIZED TEST STATISTICS: SCORE DISTRIBUTION
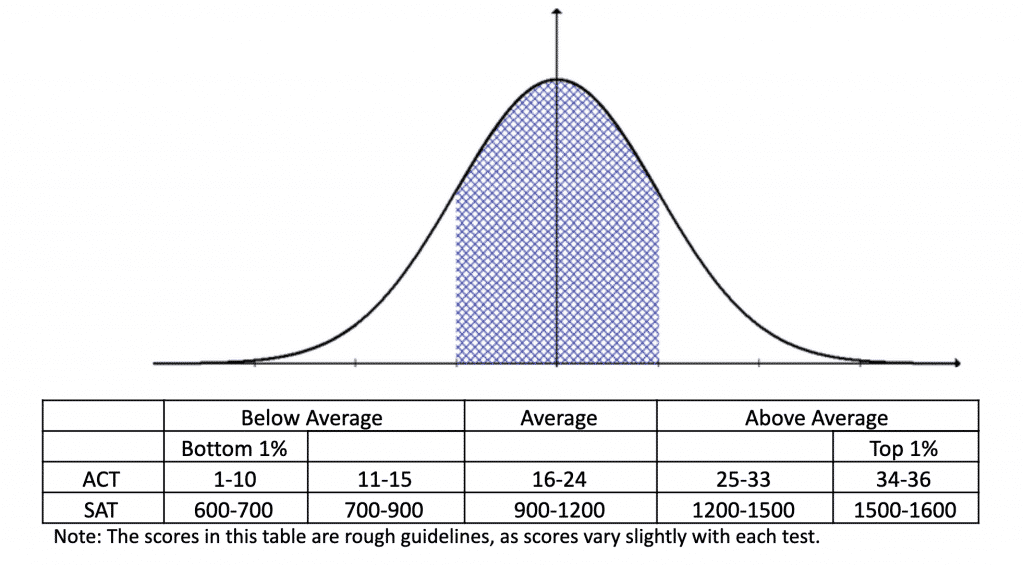
Historically, ACT and SAT scores follow a normal distribution curve (pictured above), and the majority of students (over 65%) fall within the “average” range. Within the “above average” range (approximately the top 25%), those coveted, Ivy League-worthy scores are snagged by only the top 1% of test-takers. ,p>To put this in perspective, consider the fact that around 50% of students graduate high school with an A average, but only around 25% earn above-average standardized test scores. Whether the reason is grade inflation or the standardized tests themselves, it’s clear that the skills required to earn good grades in high school are not directly transferable to the SAT or ACT.
NEXT STEPS
If you’ve taken a standardized test in the past and are less than thrilled with your scores, you are most assuredly not alone. But don’t throw in the towel just yet—in the coming weeks, my fellow coaches and I will be sharing a series of tricks of the trade to help you strategically approach the tests, avoid traps, and ultimately increase your score. Stay tuned!
Can’t wait to get started improving your score? Set up a call to speak with one of our Student Success Advisors to discuss a customized prep plan for your upcoming test!